MEETING DATE: November 7, 2018
REPORT NO: BH.01.NOV0718.R33 Pages: 17
PREPARED BY: Lisa Needham, Public Health Nutritionist, Healthy Communities and Public Policy; Amy Estill, Manager, Healthy Communities and Public Policy
APPROVED BY: Dr. Matthew Tenenbaum, Acting Director, Family Health
SUBMITTED BY & SIGNATURE: Original signed document on file: Dr. Nicola J. Mercer, MD, MBA, MPH, FRCPC, Medical Officer of Health & CEO
Recommendations
It is recommended that the Board of Health:
- Share the Wellington-Dufferin-Guelph Nutritious Food Basket (NFB) survey results with the following to increase community awareness of the cost of healthy eating:
- a. Consumers through the Public Health website and other media; and
- b. Local health and social service groups and officials.
- Forward this report to the Association of Local Public Health Agencies and the Ontario Public Health Association to assist them in advocating for those who are food insecure.
Key Points
- This report provides information on the cost of a Nutritious Food Basket (NFB) in Wellington, Dufferin and Guelph (WDG) for 2018. The NFB is a tool that estimates the basic cost for an individual or household to eat healthy. Data from NFB costing is used by Wellington-Dufferin-Guelph Public Health (WDGPH) for program planning and to promote access to healthy, nutritious food.
- In 2018, the cost of the NFB in WDG for a reference familyi of four is $210.09 per week (Appendix “A”).
- The cost of the NFB decreased 0.8 % between 2017 and 2018. Overall, the cost of the NFB has increased 27% since 2009, when the NFB Protocol was implemented.
- Individuals and families with low incomesii do not have enough money to pay for their basic needs, including shelter and healthy food (Appendix “A”).
- Food insecurity is a serious public health concern because of its relationship with poor nutrition and poor physical and mental health in adults and children. Having economic and physical access to healthy food is vital to eating well, which in turn, plays an important role in an individual’s health at any stage of life. Improving incomes is the most important response to food insecurity.
- The findings of this report highlight the need to educate the public on the root causes of food insecurity and for public health to continue to work with community partners to advocate for adequate incomes for families and individuals that allow them to buy nutritious food.
Discussion
Introduction
Food insecurity is a serious public health issue. In Canada, food insecurity is defined as the inability of individuals and households to access adequate food because of financial constraints.1,2 “Because the inability to afford such a basic necessity as food is tightly aligned with financial hardships, food insecurity is a highly sensitive measure of material deprivation (the inability to afford basic needs).”1
Local data from the 2012-2014 Canadian Community Health Survey showed that approximately 14% of households in WDG experienced food insecurity.12
Table 1: Comparison of the percentage of food insecure households in WDG and Ontario from 2012-2014
| Wellington-Dufferin- Guelph |
Ontario | |
|---|---|---|
| Marginally food insecure Worry about running out of food and/or limit food selection because of lack of money for food. |
5% | 3% |
| Moderately food insecure Compromise in quality and/or quantity of food due to a lack of money for food. |
6%iii | 6% |
| Severely food insecure Miss meals, reduce food intake and at the most extreme go day(s) without food. |
3%iv | 4% |
| Total experiencing food insecurity |
14% | 12% |
Food insecurity is associated with inadequate intake of key nutrients and a variety of negative physical and mental health outcomes in adults and children.3,4 Individuals who are food insecure are more likely to have chronic diseases, some of which include hypertension, coronary heart disease, stroke, and diabetes.3-7 Social exclusion, distress, depression and suicide ideation are some of the psychological and social consequences that can be experienced by adults who experience food insecurity.3,8-11
Methods
The Board of Health is required under the Population Health Assessment and Surveillance Protocol, 2018, to collect data on food security and food environments (including access and affordability).16 The NFB is a survey tool that measures the cost of purchasing a ‘basket’ of healthy foods in a particular place at a point in time. The composition of the ‘basket’ reflects current nutrition recommendations and typical food purchasing patterns. It is used to monitor food affordability, availability, and accessibility by relating the cost of the food ‘basket’ to the income of local individuals and families.17 The NFB survey was conducted in May of 2018 by a WDGPH Public Health Nutritionist and a trained volunteer. Food pricing in seven grocery stores, including chain and independent stores across WDG, was assessed using the 2010 Nutritious Food Basket Guidance document.18 Case scenarios were created to compare incomes and expenses for the purchase of food and rental housing for families and individuals in a variety of scenarios (Appendix “A”). The housing data used in the income scenarios represents average rental rates in the City of Guelph and were accessed from the Primary Rental Market Statistics for Guelph from the Canadian Housing Mortgage Housing Corporation.18 It is important to consider housing costs since shelter is a fixed cost. Shelter is also a critical basic need and this may resulting in households prioritizing housing expenses over other expenses like healthy food. Food bank statistics for the WDG are also presented here, to help describe how many households are impacted by food insecurity.
Findings
Nutritious Food Basket
Appendix “A” provides the results of the NFB costing activity. The cost of the NFB in WDG for a reference family is $909.69 per month ($210.09 per week). This is 0.8% lower than the cost of the NFB in 2017 ($917.22 per month), but 27% higher than the cost of the NFB in 2009 ($723.19 per month). The changing cost of the NFB since 2009 is shown in Figure 1. The results clearly show that many people in WDG do not have enough income to afford healthy food. Housing is the largest expense for most low income residents. Housing is considered affordable if it costs less than 30% of a household’s income.19 In six out of the seven income scenarios presented in Appendix “A”, the percentage of income households are spending on rent is much higher than 30% (range = 33-93%). When a large portion of income must be spent on rent, there is very little money left over to purchase food and cover other basic expenses.
Figure 1: Cost and Affordability of Nutritious Food Basket, 2009-2018.
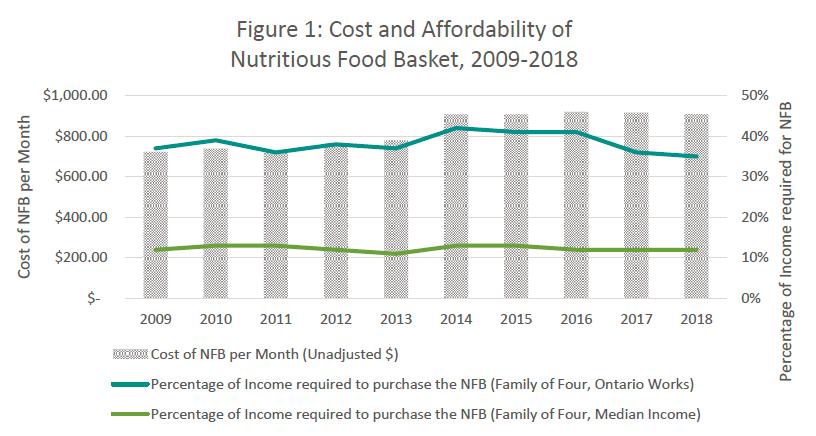
A single person on Ontario Works (OW) fares the worst, with 93% of their income going to rent, leaving insufficient money (7% of income) left over to purchase food and cover any other basic expenses. After paying for rent, a single person on OW would require an extra 31% of their income to afford healthy food excluding other basic living expenses (Appendix “A”).
A family of four with a median Ontario income is estimated to spend 15% of its income on rent, 12% on food, and has $5,761.31 left over to cover other monthly expenses. This demonstrates that a family of four with a median Ontario income can easily afford the nutritious food basket. A family of four on Ontario Works (OW) is estimated to spend about 46% of their income on rent, would need to spend about 35% of their income to purchase healthy food, and would have approximately $472.31 left to cover all other expenses (Appendix “A”).
Table 2: Presentation of select income scenarios from Appendix “A”
| Income Scenario |
Percentage income required for rent |
Percentage income required to purchase the NFB |
Total percentage of income required for rent and the NFB |
Money left for all other expenses |
|---|---|---|---|---|
| Median Ontario income |
15% | 12% | 27% | $5761.31 |
| Family of Four on OW |
46% | 35% | 81% | $472.31 |
| Single person on OW |
93% | 38% | 131% | (-$247.10) |
The scenarios presented in Appendix “A” show that when families have adequate incomes they can easily afford the nutritious food basket. It is much more challenging for families and singles dependent on social assistance to afford healthy, nutritious food. This is concerning, given local statistics which indicate that the average number of monthly OW cases in Wellington County in 2017 was 2068.20 The average number of monthly OW cases in Dufferin in 2017 was 673.21 Increases to social assistance benefits, such as the Canada Child Benefit, help to offset some of the costs of food and housing. While the cost of the NFB as a percentage of income has decreased over the past five years, nutritious food remains unaffordable for households on social assistance.
Food Bank Statistics
There are 38 organizations in WDG that provide some type of emergency food service in an attempt to meet local needs in WDG. This large number of agencies highlights the magnitude of the food insecurity issue locally.23 In 2017, the Ontario Association of Food Banks (OAFB) reported that 3334 visits were made to food banks within WDG region during the month of March.24 This statistic is an underrepresentation of the actual number of people accessing emergency food locally because it only includes the agencies who are members of the OAFB, not all emergency food providers in the region. Furthermore, despite the high number of emergency food services and individuals accessing these services, a Toronto based report estimated that only 25% of those who are food insecure access emergency food providers.25
Conclusion
Ontario Public Health Standard
WDGPH Strategic Direction(s)
Organizational Capacity: We will improve our capacity to effectively deliver public health programs and services.
Service Centred Approach: We are committed to providing excellent service to anyone interacting with WDG Public Health.
✓ Building Healthy Communities: We will work with communities to support the health and well-being of everyone.
Health Equity
References
- Tarasuk V. Implications of a basic income guarantee for household food insecurity. Research Paper no. 24. Thunder Bay: Northern Policy Institute. 2017 June.
- Tarasuk V, Mitchell A, Dachner N. Household food insecurity in Canada 2012. Toronto: Research to identify policy options to reduce food insecurity (PROOF). Available from: http://proof.utoronto.ca/wpcontent/uploads/2014/05/Household_Food_Insecu…
- Position of the Academy of Nutrition and Dietetics: Food insecurity in the United States. J Acad Nutr & Diet. 2017 117:1991-2002. [cited 27 September 2018]. Available from: https://jandonline.org/article/S2212-2672(17)31618-0/pdf
- Kirkpatrick S. Food insecurity is associated with nutrient inadequacies among Canadian adults and adolescents. J Nutr. 2010;138:604-612.
- Vogt J, Tarasuk V. Analysis of the Ontario sample in cycle 2.2 of the Canadian community health survey, 2004. [Internet]. 2007 [cited 13 August 2015]. Available from: http://www.phred-redsp.on.ca/
- Eicher-Miller H, Mason A, Weaver C, McCabe G, Boushey C. Food insecurity is associated with diet and bone mass disparities in early adolescent males but not females in the United States. J. Nutr. 2011;141(9):1738-1745.
- Gregory CA, Coleman-Jensen A. Food insecurity, chronic disease, and health among working-age adults, ERR-235. United States Department of Agriculture, Economic Research Service: 2017.
- PROOF. Lived experience of food insecurity. [Internet]. 2015 [cited 28 July 2015]. Available from: http://nutritionalsciences.lamp.utoronto.ca/resources/researchpublicatio…
- Statistics Canada. Household food insecurity, 2011-2012 [Internet]. 2013 [cited 25 September 2018]. Available from: http://www.statcan.gc.ca/pub/82-625-x/2013001/article/11889-eng.htm
- Davison K, Marshall-Gabien G, Tecson A. Association of moderate and severe food insecurity with suicidal ideation in adults: national survey data from three Canadian provinces. Soc Psychiatr Epidemiol. 2015;60(6):963-972.
- Bronte-Tinkew J, Zaslow M, Capps R, Horowitz A, McNamara M. Food insecurity works through depression, parenting, and infant feeding to influence overweight and health in toddlers. J. Nutr. 2007;137(9):2160-2165.
- Statistics Canada. Canadian Community Health Survey 2012-2014. Share File.
- Jyoti D, Frongillo E, Jones S. Food insecurity affects school children’s academic performance, weight gain, and social skills. J. Nutr. 2005;135:2831-2839.
- Gundersen C, Krieder, B. Bounding the effects of food insecurity on children’shealth outcomes. J Health Econ. 2009;18(5):971-983.
- Institute for Community Engaged Scholarship (ICES). The community researcher project: exploring economic hardship in Guelph and Wellington [Internet]. 2010 [cited 13 August 2015]. Available from: http://www.theresearchshop.ca/sites/default/files/The%20Community%20Rese…
- Ontario. Ministry of Health and Long-Term Care. Population Health Assessment and Surveillance Protocol, 2018. [Internet]. 2018 [cited 2018 May 30]. Available from: http://www.health.gov.on.ca/en/pro/programs/publichealth/oph_standards/d…
- Ontario. Ministry of Health Promotion. Nutritious food basket guidance document [Internet]. 2010:1-49. [cited 13 August 2015]. Available from:http://www.mhp.gov.on.ca/en/healthy-communities/public-health/guidancedo…
- Primary Rental Market Statistics - Guelph. Canada Mortgage and Housing Corporation [Internet]. October 2017. [cited 24 July 2018]. Available from:http://skyviewrealty.com/CMHCb/2017/Ontario2017.pdf
- Canadian Mortgage and Housing Corporation. About affordable housing in Canada. [Internet]. 2015 [cited 17 July 2015]. Available from: http://www.cmhcschl.gc.ca/en/inpr/afhoce/afhoce_021.cfm
- County of Wellington. 2017 Ontario Works caseload profile: A demographic analysis of the County of Wellington’s Ontario Works caseload. 2018.
- Pollard A. Request for stats [Internet]. Message to: Lisa Needham. 2018 June 21.[cited 2018 October 9].
- Jason T. Question: low income WDG [Internet]. Message to: Lisa Needham. 2018 October 3. [cited 2018 October 9].
- Guelph & Wellington Task Force for Poverty Elimination. Guelph-Wellington-Dufferin food access guide [Internet]. 2013 [cited 13 August 2015]. Available from:http://gwpoverty.ca/wp-content/uploads/2013/12/Food-Access-Guide-2013-Up….
- Stapleton D. Data request [Internet]. Message to: Lisa Needham. 2018 June 18. cited 2018 September 25].
- Loopstra R, Tarasuk V. The relationship between food banks and household food insecurity among low-income Toronto families. Can Public Policy. 2012;38(4):497-514.
- Kirkpatrick S, Tarasuk V. Adequacy of food spending is related to housing expenditures among lower-income Canadian households. Public Health Nutr. 2007;10(12):1664-1473.
- Kirkpatrick S, Tarasuk V. Assessing the relevance of neighbourhood characteristics to the household food security of low-income families. Public Health Nutr. 2010;13(7):1139-1148.
- Vozoris N, Tarasuk V. Household food insufficiency is associated with poorer health. J Nutr. 2003;133:120-126.
- Jessiman-Perreault G, McIntyre L. The household food insecurity gradient and potential reductions in adverse mental health outcomes in Canadian adults. J SSMPopulation Health. 2017;464-472.
- World Health Organization (WHO). Health Impact Assessment: Social Determinants of Health [Internet]. 2018 [cited 23 October 2018]. Available from: http://www.who.int/hia/evidence/doh/en/index3.html
- Fowokan A, Black J, Holmes E, Seto D, Lear S. Examining factors for cardiovascular disease among food bank members in Vancouver. Prev Med Reports. 2018;10:359-362.
- Ontario Society of Nutrition Professionals in Public Health (OSNPPH). Position Statement on responses to food Insecurity [Internet]. 2016 [cited 26 August 2016]. Available from: https://www.osnpph.on.ca/
Appendices
Appendix “A” – 2018 Nutritious Food Basket Scenarios
i Reference family is a man and woman each aged 31 to 50 years; a boy, 14 to 18 years of age; and a girl, four to eight years old
ii For the purposes of this report “low incomes” refer to the case scenario spreadsheet appendix 1 in which households spend a significantly higher proportion of their income on shelter and food compared to average Ontario family income.
iii Interpret with caution, there is a high sampling variability with these estimates.
iv Interpret with caution, there is a high sampling variability with these estimates.
v For the purposes of this report “lower incomes” refers to the case scenario spreadsheet appendix 1 in
which households spend a significantly higher proportion of their income on shelter and food compared to
average Ontario family income.